Connect your data
Bring together the operational data already available across your sites and fleets.
- No new hardware required
- No controller changes
OpenTurbine runs on the SCADA history your fleet already produces. There are no new sensors to fit, no controller changes, and no downtime to install it.
OpenTurbine is designed to work with existing wind operations - without adding complexity to the assets themselves.
Bring together the operational data already available across your sites and fleets.
OpenTurbine uses advanced machine-learning models to understand real-time performance, operating patterns, weather forecasts, and changing asset behavior.
Surface performance opportunities, emerging equipment concerns, and operational signals that merit attention.
Give teams a prioritized view of where to focus, with the context needed to evaluate next steps.
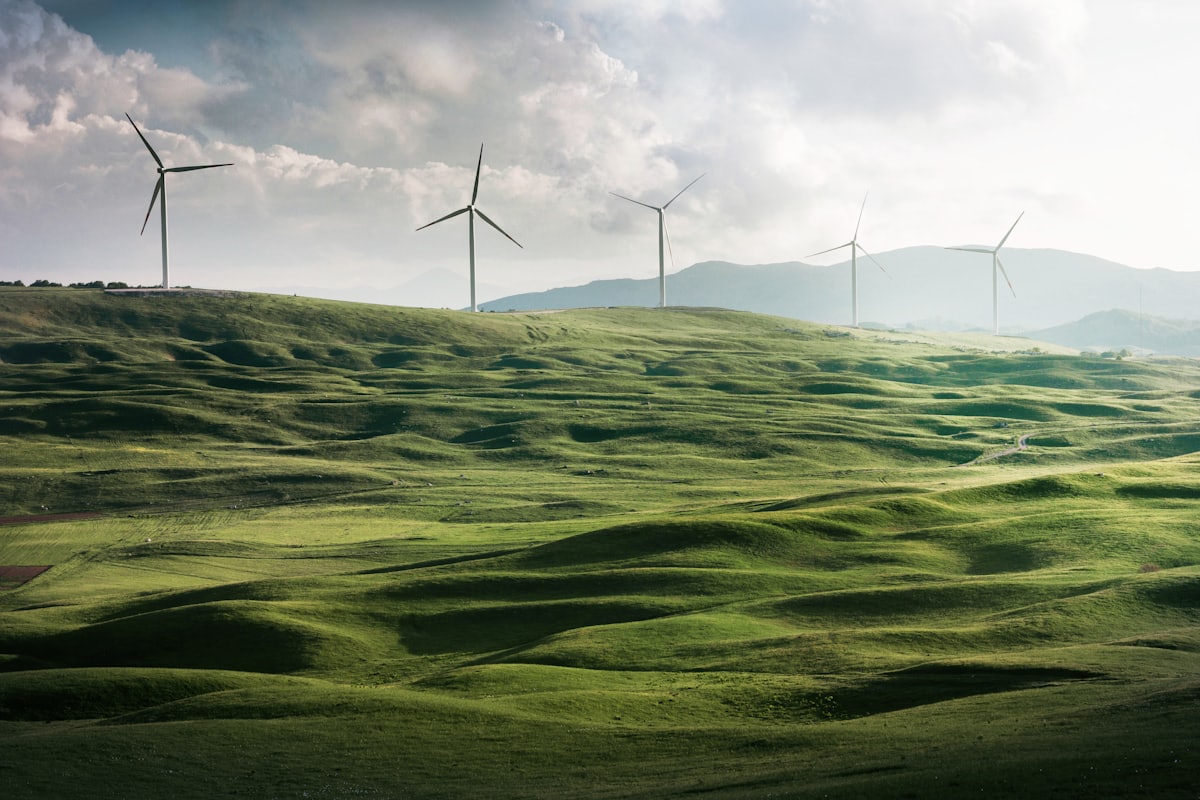
OpenTurbine brings together operational data, advanced machine learning algorithms, fleet intelligence and weather forecasts in one focused system. It gives renewable energy teams a clearer understanding of asset performance, emerging risk, and opportunities to improve generation.
How it works
The analysis runs on ten-minute SCADA data: active power, nacelle wind speed and direction, nacelle position, rotor speed, pitch angle, ambient and component temperatures, and operating state. These are the channels essentially every modern turbine exposes, whatever the manufacturer, and they are already being written to a historian somewhere on site.
Twelve months is the shortest useful history, because a shorter window contains one season of wind resource and cannot separate a machine that is degrading from one that is being measured in an unrepresentative quarter. Longer records are better, particularly for slow losses such as blade erosion that develop across years rather than months.
Nothing is installed at the turbine, nothing changes in the control system, and no certification work with the original equipment manufacturer is involved. That boundary is deliberate: anything that touches the machine converts a data question into a warranty conversation and moves the decision from an operations team to a legal one.
Curtailment is held out first. A curtailed hour looks exactly like severe underperformance in the raw record, and a model trained through one learns curtailment as normal behavior and then reports its absence as a gain. The same applies to forced outages, manual interventions, and icing periods on cold-climate sites.
Sensor faults are treated as findings rather than as noise. A drifting nacelle anemometer is one of the most common causes of an apparent loss that is not there, and it is also one of the most common ways a real loss stays hidden - the machine underproduces and reports less wind at the same time, so the pair looks consistent. Cross-checking a turbine's own wind measurement against its neighbors is part of the analysis, not a precondition for it.
The record is not cleaned before it is sent. Gaps, flat lines, and outliers identify a sensor fault or an unrecorded outage, and removing them upstream removes the evidence along with the mess. It is easier to reconstruct a messy export than to recover one that has already been tidied.
For each turbine, a normal behavior model learns what a channel should read given the conditions driving it: power from wind speed, direction, air density and turbulence intensity; gearbox oil temperature from load, ambient temperature and rotor speed. The model is trained on a period the machine was healthy, then run forward.
The residual - measured minus expected - is what carries the information, and the construction is what makes it interpretable. A raw temperature rising in July says nothing. A temperature five degrees above what the model expects for that load and that ambient says a great deal, and a residual that grows steadily across six weeks is a different object from a reading that is merely high on a warm afternoon.
This is why the comparison is against the turbine's own history rather than against a datasheet power curve. The published curve describes a new machine in standardized air on a test site; measured against it, almost every asset in a mature fleet appears to underperform, and a finding that applies to everything directs attention to nothing.
Each finding names the turbine, the loss mechanism, the period the deviation was observed over, the annual energy at stake, and the evidence behind the estimate. Where a price basis is available, the energy is also expressed in revenue, because a work list sequenced in megawatt-hours and a budget argued in dollars are otherwise two conversations.
Confidence is stated rather than implied. A production deficit is an inference from a model, not a counted quantity, and a figure presented without that distinction will not survive the meeting it was produced for. The ranking is inspectable for the same reason: an operations manager who disagrees with the weighting should be able to see the effect of a different one.
Four boundaries worth knowing before an evaluation, because every one of them will be found in the first month otherwise.
The analysis establishes that degradation is underway and how urgent it is. A remaining-useful-life figure quoted to the day is a modeling artifact rather than a measurement, which is the honest distinction between predictive maintenance and condition-based maintenance.
Ten-minute averaging removes the high-frequency content classical condition monitoring relies on, and no modeling recovers it. Where a vibration system exists its data is read alongside the operating record; where none exists, temperature relationships still move the detection date forward by weeks.
A fleet whose historian retained only monthly totals, or whose fault codes were never mapped across manufacturers, needs that fixed first. This is the most common reason an assessment takes longer than expected, and it is worth establishing before a schedule is agreed.
A finding is evidence for a decision an operations and maintenance team makes and a crew carries out. The platform issues no control instruction and writes nothing back to a turbine.
Every term below has a full definition in the wind energy glossary, written for the people accountable for a fleet rather than for a search engine.
See how OpenTurbine can help your team understand performance, anticipate operational issues, and make better decisions across your wind assets.